

There is a better way. Many organizations, of all sizes, struggle to use analytics to improve their operations because of information “silos”. Silos occur when the applications that run different parts of your operations can’t communicate with each other. For example, if the applications that track orders or labor or expenses are separate, you can’t make a profit and loss statement until accounting posts everything to the financial system and the month is closed. Behind the scenes, analysts are downloading reports from these applications and crunching the numbers in a spreadsheet. Sometimes it works, sometimes it doesn’t because the process is manual and labor intensive and prone to mistakes. You know you have a silo problem when you are unable to answer simple questions behind the reports – asking for the detail behind a number, for example. In some ways, the rise of cloud applications has made this worse because access to the data is different than it used to be. 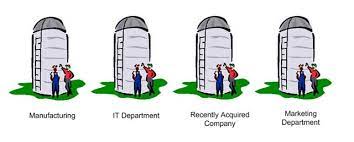
The time and challenge of collecting, organizing and presenting data in a meaningful way is preventing you from providing relevant information to management. If you have all of the data you need, it’s hard enough to make succinct and meaningful reports that provide insight to understand performance. But when it takes almost all your time just to collect the data? And when they ask a follow up question? Maybe some supporting detail? Or a comparison for context? With time consuming manual processes, you spend too much time collecting, organizing and validating data, and do not have time to do the advanced analytics you need to get ahead. 
Manual processes are error prone and create risks, dependencies and bottlenecks. Downloading reports from various applications and collecting spreadsheets from various stakeholders is a long, slow and brittle information supply chain. You can’t ever take the first week of the month off because that’s the week you collect the data and assemble the presentation. You haven’t documented the process well enough yet to have your backup do it. This is partly because of the time involved, but, it’s also hard to document a process when there’s some sort of hiccup every month anyway. It’s a pretty shaky foundation for the monthly ops review, but what else is there?

Complex spreadsheets with years of hacks built into them. The spreadsheet is complicated with tabs, functions and calculations on top of calculations. Sometimes the downloads break them and it takes hours to fix them. Like finding a needle in a haystack. More than once your reports went out and they found errors. As easy as it looks, changing the output is no small task. And let’s just ignore the risk of the Excel guru leaving. The reports aren’t yours, and sometimes they disappear, sometimes they just change a little and break the spreadsheet. Worse, sometimes they change in a meaningful way, but nobody tells you and you don’t notice until the deck gets emailed. Some of these reports go back to your predecessor’s predecessor and some of them you don’t completely understand. This is a house of cards.

With little trust in the numbers, very little changes. Management isn’t sure if they trust your numbers, maybe they are just enough to be “directional”, but to make strategic decisions? It’s too big of a risk, so they go with the status quo – and that is a slow death. If you don’t trust the information to be accurate, they won’t take action based on it and the opportunity will be lost.

There is a better way. Providing analytics and insights that are secure, reliable, and accurate. That you count on because they are transparent and traceable. And automated. Don’t build analytics with reports and downloads. Build analytics with data. The foundation is collecting and organizing data with simple and reliable processes. Starting with the basics – orders, admissions, inventory or transactions, but with a much bigger vision in mind. A strategy to create an analytics platform with data that is integrated, reliable and accurate. A well designed data foundation is the foundation of an effective analytics platform.

Then you put powerful tools on top of that, tools that help you understand, tools that explain through transparency, context, detail and intelligence. Tools that meet your needs with capability, simplicity, performance and flexibility. If you are setting out to build an analytics platform, make sure the tools you use have the features you need to deliver on that vision.
What does it take to get started? A little talent, some experience, the right tools and a plan. Send me a note, I would love to talk about it. elealos@quantifiedmechanix.com