Scope of data
Data has been downloaded from CMS, and transformed into a dimensional model to support meaningful reporting and analysis. The physical data model has been delivered to Snowflake with primary key and foreign key references to facilitate model creation in reporting and visualization tools.
This data set includes:
- Monthly data for 15,000+ providers in the United States.
- Monthly Star ratings and related ratings for inspections, staffing and quality starting in 2017.
- Monthly Occupancy (average daily residents) and certified beds for every provider starting in 2017.
- Monthly abuse ratings, incident counts, fine counts/amounts and payments denied for all providers starting in 2017.
- Detailed survey data, and survey summaries (inspection and complaint) from 12/2017 forward.
- Monthly staffing detail (hours per resident) for all staff types, raw, case mix and adjusted
- Quality detail for all quality measures 2017 forward.
Business Value of CMS Star Rating Data
You can use this data to:
- Compare provider performance in staffing, inspections, quality and occupancy to peers.
- See the connection between performance across domains – how staffing affects quality, for example.
- See and understand the capacity and occupancy of local markets and how it has changed over time.
- Create forecasts based on current trends and past seasonality in the local market.
- See how your staffing levels and staff mix compare to your peers in the local market or across your state.
- Understand how to hit staffing level and staff mix targets efficiently.
- Define operational targets and benchmarks for staffing and use them to manage day to day operations.
- Understand the impact of complaints and citations on your survey rating and when your rating will change.
- See when your competitors were inspected, what the results were and when their rating might change.
- Understand the impact of quality measures on your quality rating and the best opportunities to improve.
- Gain detailed insights of your competitors and use them to get more referrals.
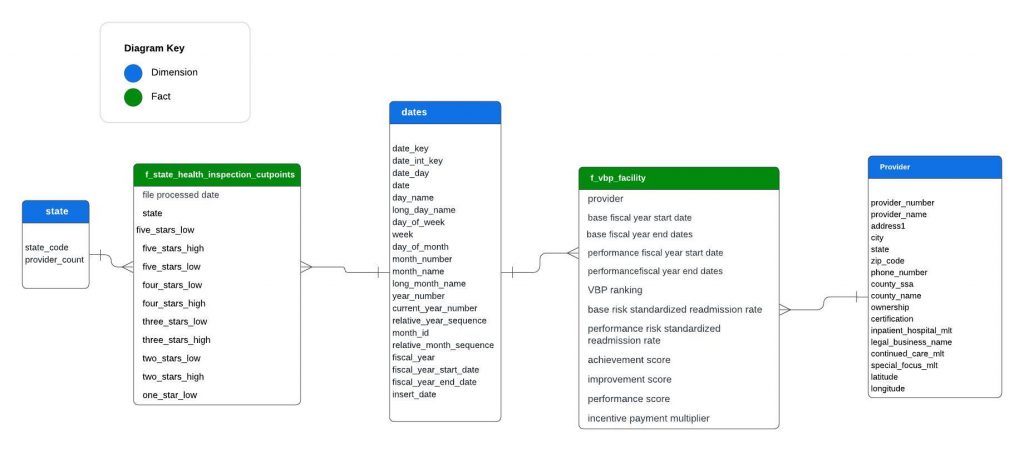
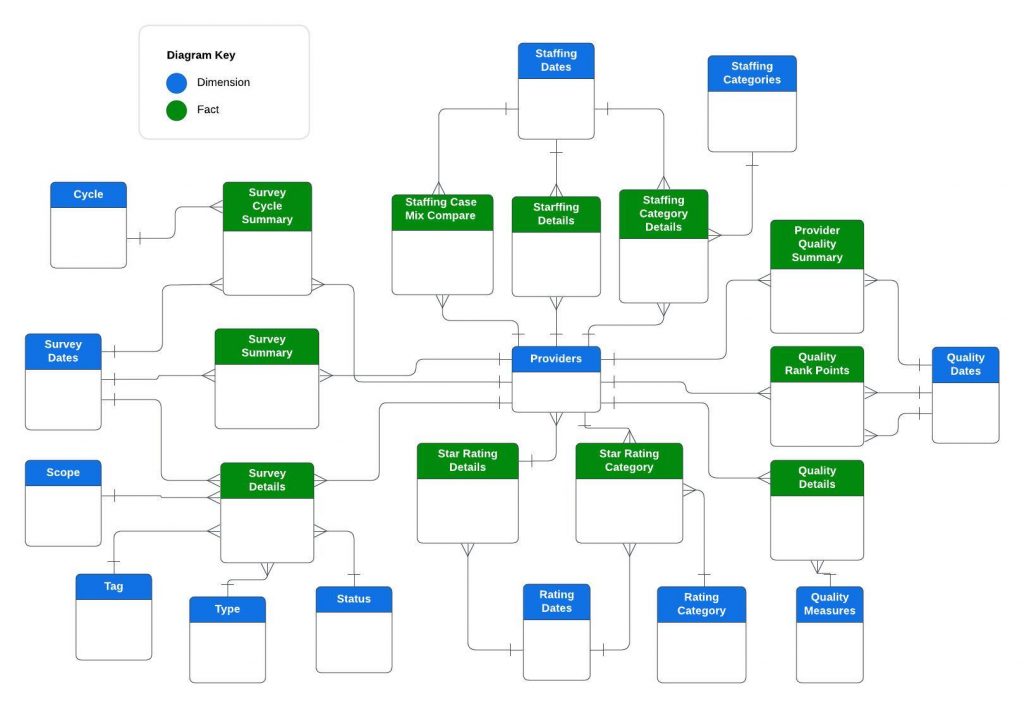
Logical Entity Relationship diagram
The ERD below shows the entities and the relationships that are part of this data set. All of these objects are physical tables. However, there is only one date table. It has been shown here in various roles for clarity. There are additional tables that are not represented here because they do not reasonably fit on the diagram..
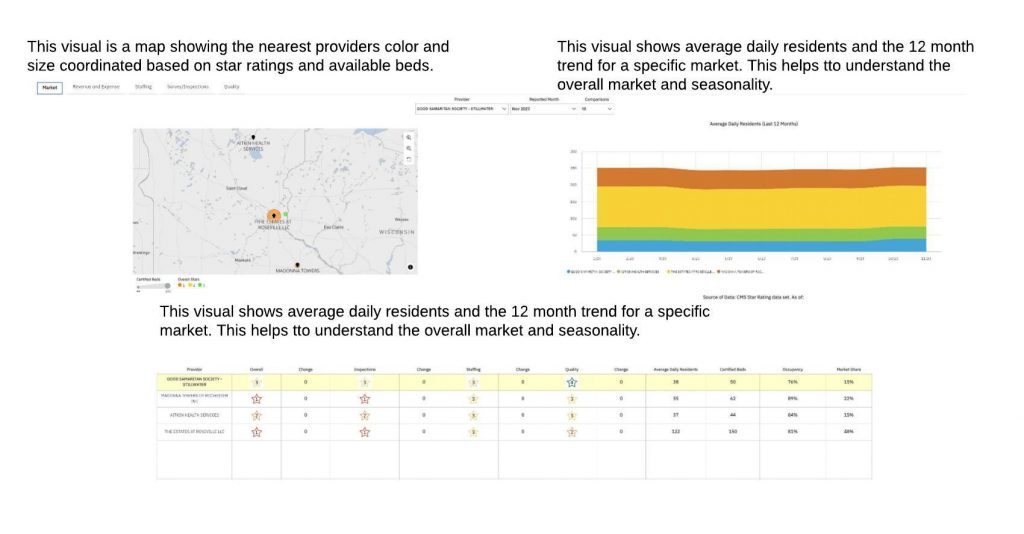
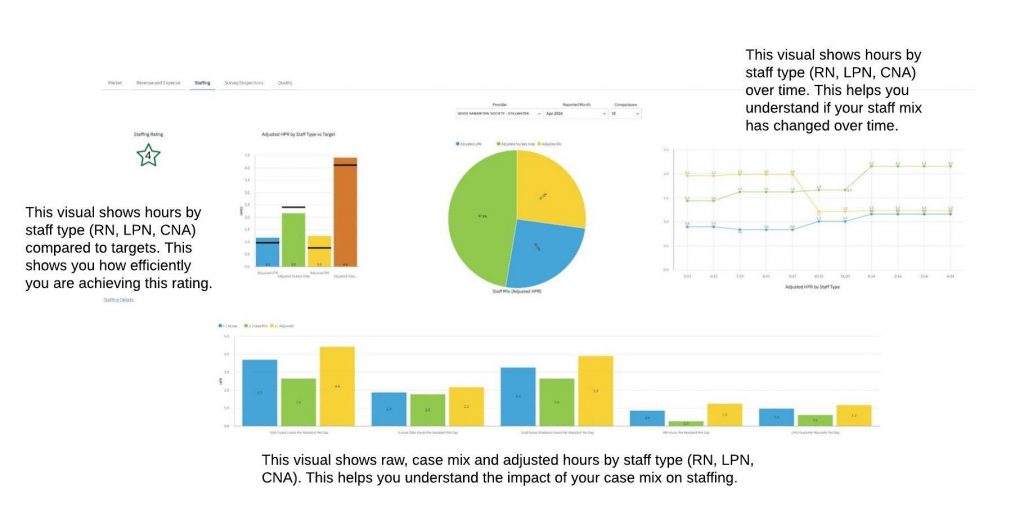
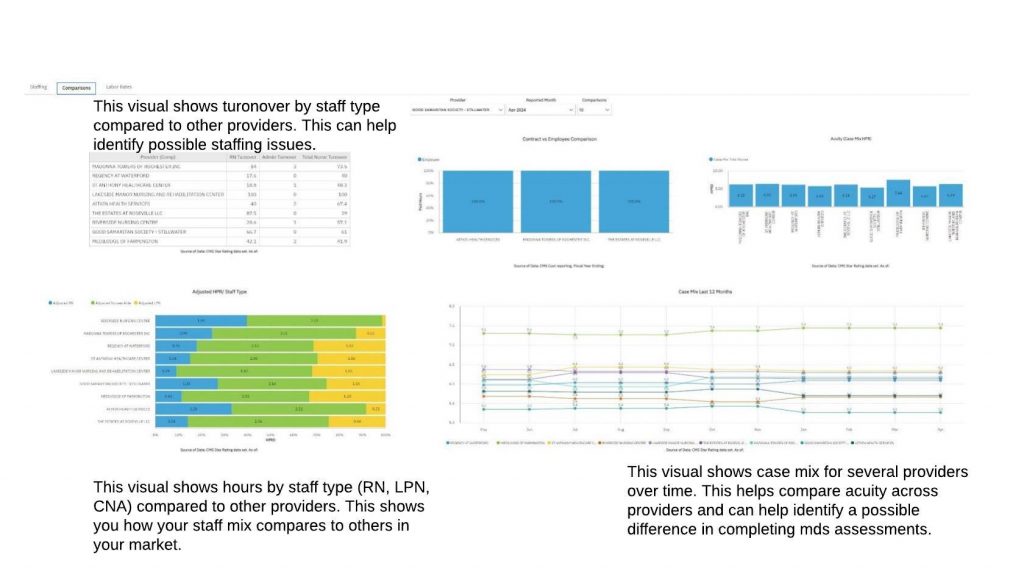
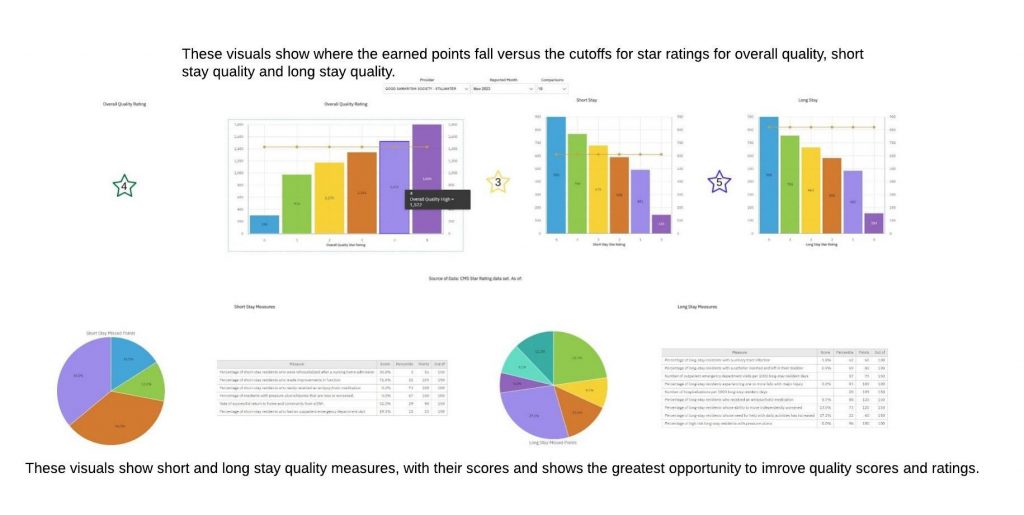
The following are examples of the analysis and visualizations this dataset supports.
We are able to assist you in creating these visualizations and similar content.
June 28, 2024 Update
🔹 VBP Details Added: We’ve added Value-Based Purchasing (VBP) details for providers from 2020 up to and including 2024. This comprehensive data allows you to analyze and benchmark provider performance over the past four years.
🔹 Survey Cutpoints Added: All states now have survey cutpoints data from 2020 up to and including June 2024. Gain valuable insights into state-specific benchmarks and trends to enhance your strategic planning and decision-making.